Gen AI’s Role in Data Visualisation: Transforming Data into Dynamic Insights
A lot has been said and discussed about the significance of data cleansing, data migration, data integration and data analytics. However, the most important aspect of decision-making is based on your organisation’s approach to data visualisation. Data visualisation is all about the ability to decipher data and represent the derived insight in an understandable way. The current approach to data visualisation involves rule-based scenarios where data is analysed according to pre-defined values. This restricts organisations’ ability to identify challenges, uncover hidden patterns and predict opportunities more precisely and reliably.
Generative AI (Gen AI), a subset of artificial intelligence, has the potential to revolutionise data visualisation and offer new possibilities for organisations to fully exploit their data’s potential. This blog discusses how leveraging generative artificial intelligence can transform data into dynamic insights.
Generative AI - An Overview
As stated, generative AI is a class of artificial intelligence that can generate new content based on data it has been trained on. The ability to create datasets for rare and impractical scenarios through generative artificial intelligence helps organisations handle all kinds of situations with ease and convenience. For example, consider the automobile industry, which designs self-driving cars powered by AI.
To help the AI models stimulate human driving capabilities, it is recommended to train the models with real-world datasets subjected to critical conditions like severe weather conditions, hilly terrains and unexpected pedestrian behaviour. However, sourcing them takes time and effort. But with the help of generative artificial intelligence, this is made possible as it helps with the following three activities.
1. Synthetic Data Generation
The automobile organisation, with the help of generative AI, creates synthetic driving data stimulated by various scenarios, such as heavy traffic jams, impromptu weather changes, and a few other unexpected turnaround accidents and events.
2. Enhancing Training Data
Synthetic data generated through generative artificial intelligence is added to the real-world dataset, thereby increasing its volume and diversity. This helps the AI model train on a vast variety of data, encompassing scenarios of various intensities and conditions.
3. Testing Rare Scenarios
The automobile industry will need more rare and unexpected scenario data, which can help the AI model train more efficiently and accurately. Generative AI helps by stimulating rare and dangerous events, like a child running into a car in the street, the sudden repair of the braking wire, or the severe breakdown of a vehicle on a highway. All this may or may not occur, but it is essential for the vehicle and the AI model to be aware of such incidents and respond immediately.
Thus, generative AI plays a crucial role in creating and enhancing realistic and deep data sets that allow the AI model to identify challenges, uncover patterns, and derive opportunities.
Components of Generative AI
There are two main generative artificial intelligence architectures or algorithms that support the aforementioned potentials. Let’s analyse them in detail.
- Generative Adversarial Networks (GAN): In generative AI, GANs comprise two neural networks—the generator and the discriminator—that are simultaneously trained using adversarial learning. The main function of a generator is to create or generate data sets as realistic as the trained dataset, whereas the function of the discriminator is to evaluate and classify real data from the trained data samples and identify fake data from the data generated by the generator. The adversarial training enhances the abilities of both neural networks, empowering them to generate realistic data sets and distinguish fake from real ones, respectively. Thus serving as one of the main foundations for generative AI in creating synthetic data generation.
- Variational Autoencoders (VAEs): As a powerful generative artificial intelligence architecture, the VAEs comprise two responsible components, one for encoding and the other for decoding datasets, to create new and realistic datasets. The encoder helps transform the input data into a lower-dimensional representation known as latent space. This helps in capturing the essential features of the data. Whereas the decoder reconstructs the latent variables into data samples, representing the original data as closely as possible. This ability of VAEs to produce realistic data by learning the underlying distribution of input data empowers them as one of the most valuable tools in data generation and dimensionality reduction.

Challenges and Complexities of Data Visualisation
Before examining the role of generative AI in data visualisation, let’s analyse the current challenges in data visualisation and how they are limiting an organisation’s ability to drive insights and informed decisions from data.
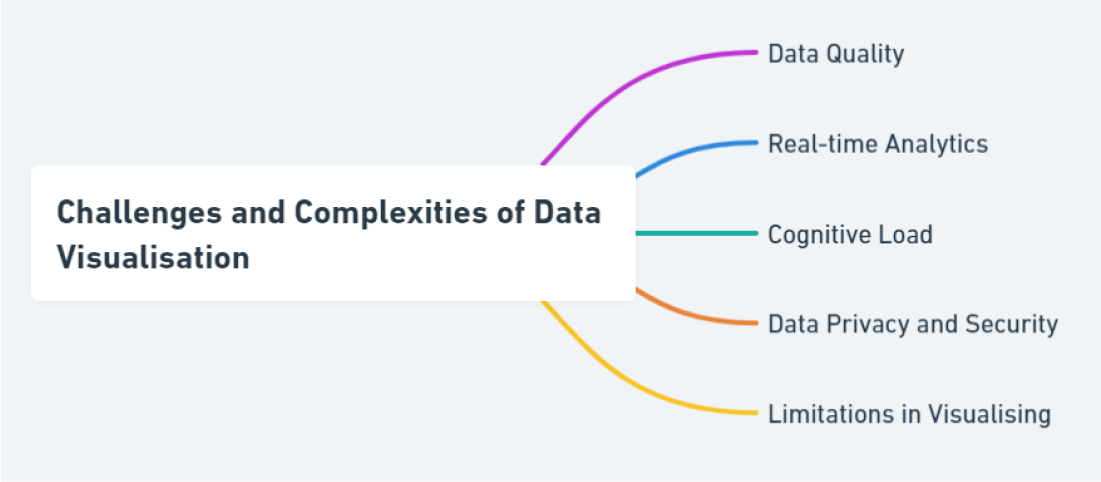
Data Quality
The foremost challenge for data visualisation starts with the quality and completeness of the data used for analysis. Any missing values or inconsistent datasets can lead to wrong conclusions, which can then be visualised inaccurately, leading to wrong decision-making.
For example, an inventory data set with missing values can lead to inaccurate forecast trends and wrong sales calculations.
Real-time Analytics
Gaining real-time visualisation of data from streaming devices or emergency responses is challenging as the velocity of the data is high. Accommodating them as data arrives is crucial for businesses with small infrastructure. Also, a low latency rate is required to process the data and maintain its relevance.
For example, visualising stock market data as it arrives proves challenging and complex owing to its velocity, variability, and volume.
Cognitive Load
The ability to read and analyse the visualised data sometimes poses a challenge for users when confronted with complex visualisations. Also, if the visualisation is cluttered or loaded with informational density, it becomes difficult to interpret or analyse insights.
For example, the marketing team’s data visualisation dashboard at month-end contains too much information, such as employee details, sales insight, and turnover figures.
Data Privacy and Security
Utilising personal data or proprietary information for analysis involves checking necessary regulations and compliance adherence to ensure data security. It is also important to ensure that the data used is encrypted both at rest and in transit, reducing unauthorised access and data breaches.
For example, when dealing with patient data in healthcare, anonymizing sensitive details per guidelines like HIPAA helps visualise the data responsibly.
Limitations in Visualising
Certain data visualisation tools or techniques lack the ability to represent insight in the desired format or layout per business need. Some tools have only a few filtering options, and some do not support many data types or formats.
For example, supporting and visualising financial data from diverse sources, such as customer applications, loan approvals, and transaction details, which are in different formats and structures, is challenging and crucial.
Gen AI’s Role in Data Visualisation
- Data Imputation: This process of generative AI is responsible for correcting errors or filling in the missing values within the dataset. Generative AI models are trained based on the available datasets, where they learn patterns and relationships between data. This helps them predict the missing or inaccurate data value, ensuring the dataset is complete and accurate for the data visualisation process.
- Simplified Visualisation:
Presenting data into compelling stories and dynamic insights is essential for modern organisations, as they have too much information floating around the visualisation board. With the help of generative artificial intelligence, organisations capture the most relevant data points and present them in a clear and structured way, optimising the layout, colour, and style. This empowers organisations to filter unnecessary information and focus on key highlights needed for informed decision-making. - Secure Data Handling:
Protecting sensitive data is important, and generative AI plays a major role in this by applying advanced encryption algorithms, access controls based on roles, and pseudonymization, where the data is replaced with fake identifiers. This helps secure the data from unauthorised access and protect individual details throughout the visualisation process. - Adaptive and Real-time:
Generative AI models are designed to adapt, optimise and visualise insights based on data as it becomes available from streaming platforms, batch updates or periodic renewals. This helps the AI model detect emerging trends or relevant patterns for the organisation and visualise them by adjusting the context and focus of the information. This continuous learning capability of the generative AI model helps reflect the latest trends and insights.
Thus, the role of generative artificial intelligence in visualisation goes beyond presenting insights
With a traditional data visualisation tool, organisations may need more ability to be compatible with generative AI models. Offering an intuitive and user-friendly visualisation is essential, and two advanced visualisation tools on the market support this. Leveraging data visualisation tools can help your organisation turn data into dynamic insights vital in making informed decisions.
Advanced-Data Visualisation Platform
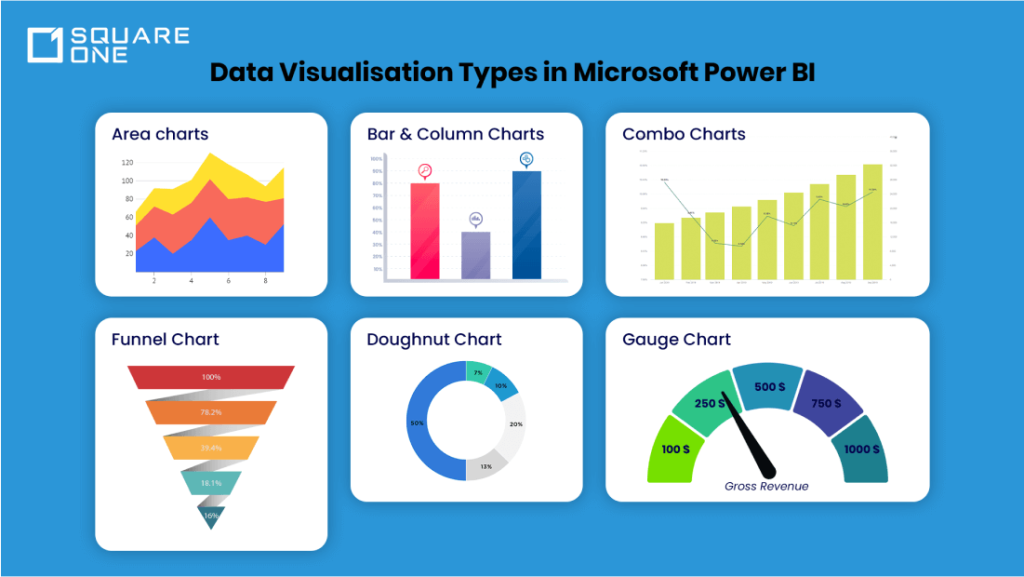
1. Microsoft Power BI
Microsoft developed Power BI, an advanced and user-friendly business analytics tool, to empower organisations to transform raw data into actionable insights with interactive visualisations and business intelligence capabilities. It is one of the most sophisticated visualisation tools that data analysts, data scientists, and other users can use to interpret, interact with, and get the latest insights and trends. Compared to traditional data visualisation tools, Power BI is designed to offer rich and relevant analytical reports that help businesses stay relevant and informed about the next steps in their processes. Would you like to know why Power BI is one of the most sought-after data visualisation tools? Of course, Power BI’s unique features, along with generative artificial intelligence, make it an enhanced tool for data-driven decisions.
- Seamlessly integrates with Microsoft 365 applications like Excel, Sharepoint and Teams. This empowers organisations to easily import data, share insights and collaborate with users across the application.
- Power BI also integrates with Microsoft Azure, enabling users to connect with various Azure services, such as Azure SQL Database, Azure DataLake, and Azure Machine Learning.
- The platform also supports real-time integration of data from various sources, allowing users to create live and interactive data visualisation dashboards that help them visualise and interpret insights necessary for decision-making.
- The tool leverages Microsoft AI and Machine Learning abilities through Azure Cognitive Services. This way, users can incorporate AI-driven insights such as image recognition, anomaly detection, and natural language processing into their reports and dashboards.
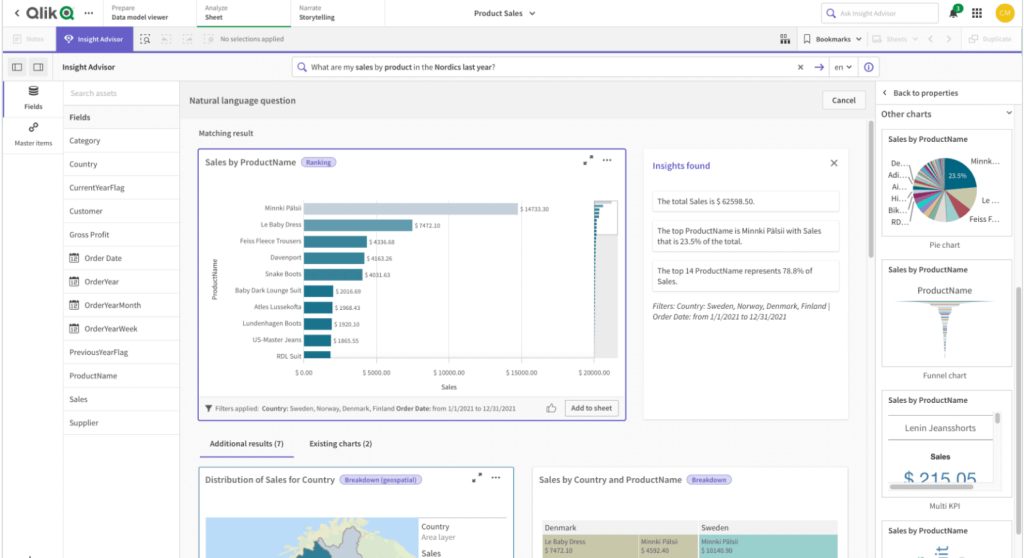
2. Qlik Sense
Qlik Sense by Qlik is one of the most interactive and intuitive visualisation platforms. It helps organisations retrieve data, visualise insights, and interpret decisions, thereby making data discovery and analytics accessible to both data analysts and users. As a premium data visualisation tool, Qlik Sense harnesses the power of generative AI and offers the following capabilities.
- Known as a self-service visualisation tool, Qlik enables users to easily access and visualise data by filtering out unnecessary insights.
- With its interactive data visualisation dashboard, every element is highlighted, empowering users to focus on the most recent insight or the latest trend.
- With search-based discovery and insight advisory, Qlik auto-generates the most relevant insight for the user.
- Qlik AutoML employs users to create ML models with no code, providing a straightforward exploration of data and insights.
- Enables data monitoring through Qlik altering and automating technology. This way, users can stay informed and updated.
- Create flexible, dynamic reports and publish them in any desired format, like Microsoft Office or PDF.
Overall, Qlik Sense is the new-age data visualisation tool or technique that organisations need. Try it and witness how your data transforms into dynamic insights at your fingertips.
The Strategic Advantages of Data Visualisation and Generative AI
Before concluding the blog, let’s briefly examine the benefits of data visualisation and why organisations should consider adopting generative artificial intelligence to enhance their effectiveness.
- Analysing and transforming large volumes of datasets into simple graphical visualisations helps organisations learn and unlearn complex correlations, patterns and challenges, thus easing data interpretation.
- Visualising data insights in the form of graphs, Gantt charts, or compelling stories helps organisations focus on key metrics and understand hidden patterns and insights.
- Making data accessible and understandable to every member of the organisation helps drive a data-driven culture, facilitating accurate and reliable results based on data rather than intuition.
- Presenting data with intriguing visuals and captivating stories helps engage and communicate complex analysis and challenging insights well with stakeholders, professionals and common users, empowering them to be more involved in strategic decision-making.
Conclusion
To conclude, data visualisation is crucial for organisations to simplify insights, trends, and patterns. However, to fully leverage data visualisation, adopting generative AI is essential. Generative AI generates synthetic data, trains on large datasets, and enhances data security and privacy, resulting in a more accurate and deeper exploration of data that traditional data visualisation methods cannot achieve.
Partnering with digital transformation experts like SquareOne allows organisations to maximise their data visualisation capabilities. As partners of leading data visualisation tools like Microsoft and Qlik, SquareOne provides professional assistance to ensure seamless, effective, and efficient digital transformation solutions. This enables data-driven organisations to remain competitive in the digital world, making it imperative to gain valuable insights. Get in touch with SquareOne experts to enhance your data visualisation capabilities and drive your digital transformation forward with advanced and breakthrough solutions.